Abstract: This article briefly describes the three ways in which Zijinqiao Software reads historical data. It focuses on the differences between different methods of operation for batch history and the differences between methods.
Text: Zijinqiao software comes with a process database, which can efficiently save the history of related data points, while providing a wealth of methods to read the required history.
About saving historyThrough the Zijin Bridge Configuration Software's own process database, the historical records of the data points can be automatically saved in two ways, the timing preservation and the change rate preservation, the timing preservation suitable for the preservation of changes is not fast, or more regular data points, the rate of change The scope of application of the save is relatively more extensive, suitable for changing quickly or slowly, here are two things to note:
1. For the historical records that are stored at regular intervals, no compression is usually performed. Therefore, it is not recommended that more database points be set to save at shorter intervals. Otherwise, the file size of the historical records will increase relatively quickly.
2. For the data saved in the rate of change, the system will automatically compress and save. It should be noted that the rate of change is relative to the range of the point, rather than relative to the last saved historical value. The data point range can be modified in the "point configuration" basic parameters;
Personally think that the process database is very suitable for the preservation of continuous collection of field values, for some character-type data may also need to rely on a relational database to retain the historical value. Relational databases are also far less convenient for storing continuous values ​​than process databases. The various operations of Zijinqiao on relational databases will be explained in other documents and will not be repeated here.
Zijin Bridge software provides a variety of ways to read historical data. Here are some common methods to illustrate. There are generally three ways to read the history records: history curve, read single point history, read batch history. Before explaining various methods, first explain the concept of “bad valueâ€. The data points can only save the history record when the system is running. For the system, there is no history value during the operation. If the moment is earlier than the current moment, Zijinqiao software usually Will give a bad value, -9999. However, the historical value of the untimed time can be set in the "system parameters" as shown in the figure:

The following is a brief description of the three operations for reading history records:
1, through the history curve
Historical curves or trend analysis curves can be directly used to query historical values ​​of related points. The advantage of this method is that the data is intuitive, convenient, and the curves can be arbitrarily enlarged.
Historical curve:
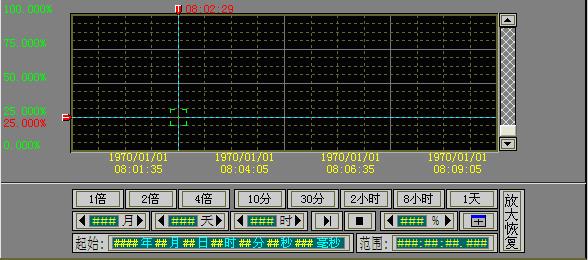
trend analysis:

The difference between the historical curve and the trend analysis curve is that the history curve can be decomposed by the operation of the “split unit†and recombine according to the need; and the trend analysis component is more powerful, providing statistical data without the history curve, full screen Display and other functions, but does not support decomposition operations, can not be combined.
2, read a single point historyCollecting the historical value of a certain point at a certain time or the statistical value of a certain period of time is generally realized through a script function:
1, reading a historical value at a time generally use three functions:
GetHisData(Var,Year,Month,Day,Hour,Minute,Second,MilliSec);
GetHisData2(Var,StartTime, MilliSec);
GetHisDataEx(DataSource, VarName, StartTime, MilliSecond);
The former GetHisData and GetHisData2 is suitable for reading the historical value of a specific moment, the latter through a time value to obtain the historical record, this value is an integer, which represents the second relative to the number of seconds past 08:00 on January 1, 1970, this second The number is very common in Zijinqiao software. In real engineering, this number of seconds can be obtained by the function LongTime ("2001/01/01 14:50:48"), which automatically gets the number of seconds past a certain time. The number of seconds can also be obtained by some components, such as the start time component, as shown in the figure:

There is a start time component in the graph, and below it is the number of seconds that the time attribute of the component corresponds to 1970/1/1/08:00:00. For example, the component is named EndTime. The number of seconds can be obtained by #EndTime.time in the script.
2. Reading the statistics for a certain period of time can be obtained by the function GetStatisDataEx(DataSource,VarName, StartTime,TimeSpan, Flag,Time) or GetStatisData (Var, Year, Month, Day, Hour, TimeSpan, Flag, Time) The maximum, minimum, or average value within.
Val = GetStatisDataEx("","FQ101.PV", LongTime("2007/09/04 14:30:00"), 2,0,strTime) The Val variable in the example can get the FQ101.pv value in September 2007 The average value within 2 hours from 14:30 on the 4th. It should be noted here that the GetStatisData and GetStatisDataEx functions automatically filter out bad values. When using statistical functions, ensure that the corresponding points are selected during the configuration, as shown in the figure:
In addition, it should be noted that since the Zijinqiao system automatically records historical records every hour, for the newly saved historical records, such as historical values ​​within 1 hour, statistical functions may not be able to obtain the latest statistical values. If you need to get real-time statistics, you need to use the SPC history component provided by Zijinqiao Software to perform statistics. For some operations on this component, please refer to the Zijinqiao software-related help documentation.
3, read the batch historyReading batch history is usually displayed as a report. For the historical report, there are different divisions according to different standards. According to the number of lines, it can be divided into fixed and irregular lines. According to the type of display, it can be divided into statistical and non-statistical historical reports. The so-called statistical report is usually the statistics of some accumulated value points, such as the maximum value, minimum value, or average value, etc. Non-statistical statements are directly inquiring historical values ​​at a certain time. The specific implementation methods are also different in different situations. Here I will briefly describe the methods familiar to the author.
Non-statistical historical reports with a fixed number of rowsFor a history record that needs to be acquired for a certain period of time and a fixed time interval, the number of rows is usually fixed. For example, it is necessary to sample the whole point value in one day, the number of rows is 24, and the time interval is one hour. In this case, using the "free batch history" function of the free report is the simplest. The specific operating mode is briefly described as follows:
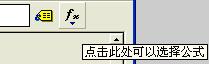
First select the column in the free report that needs to display the history, and then click the formula selection button on the right side of the free report toolbar, as shown in the figure:
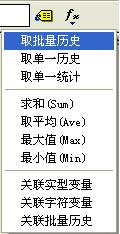
Click to select "fetch batch history" as shown in the figure:
The system pops up a dialog box:
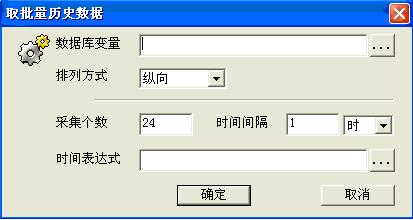
In the "Database Variable", fill in the associated data points, such as "A1.pv", and set the "Number of Acquisitions" and "Interval" according to the actual situation. The "Number of Acquisitions" cannot be filled in as a variable. The “time expression†here refers to the time of the first collection point in the batch history, which can be an integer variable whose value is the number of seconds past 08:00 mentioned on January 1, 1970, above.
Advantages: By taking the function of batch history, you can easily obtain a fixed historical record with a certain number of points and a fixed time interval.
Disadvantages: Can not achieve the acquisition time is not fixed, the number of acquisition history records is not fixed, unable to collect statistical values.
Tip: When displaying historical records, you often need to display the time corresponding to the record in another line. You can select a column, set the input and output of the column to “date and timeâ€, and then correspond the column association with the historical value. Seconds can be.
Non-statistical reports with a fixed number of rowsSometimes it takes the user to set the start time and end time of the historical record query, and the interval between the history records of the query. In this case, historical data objects are often used to obtain records.
Select historical data object in Historical Data in the gallery of Zijinqiao, as shown in the figure:

Drag it to set the window, the system automatically adds a historical data object, as shown:
Double-click the object, you can set the parameters in the Properties dialog box, as shown:
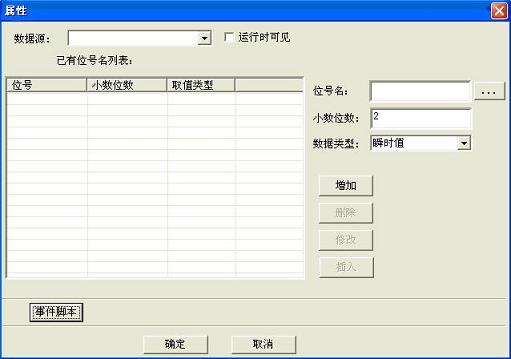
This component is usually hidden when it is running. You can increase the history of the desired query in the Properties Settings dialog box (you can query more than one at a time). By clicking on the "event script", you can write the required script statement here, as shown in the figure:
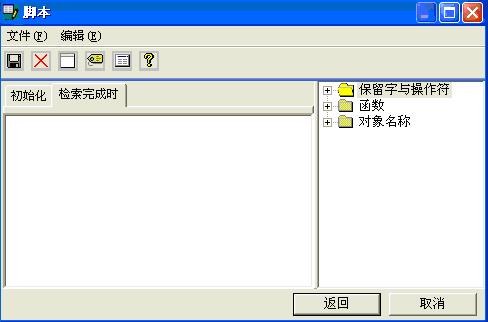
The Start(BeginTime, Cycle, Count) function of the historical data object is usually called by a button or the like. Through this function, the start time of the query, the time period of the query and the history number of the query can be set, and the query can be performed. When the query is completed, the "When the search is completed" script is executed. In general, a loop statement is used in the script when the search is completed, and the result of the query is updated into the free report. For example, the script:
Num=#his.GetColCount();//Get the number of rows in the query
For k=1 to num+1 step 1
#report.settxt(1,k+1,#his.GetTimeText(k-1,0));//Get time
#report.settxt(2,k+1,#his.GetCellText(0,k-1)); //Get the historical value of variable 1
#report.settxt(3,k+1,#his.GetCellText(1,k-1));//Get the historical value of variable 2
Next
The script first obtains the number of rows of data that are queried by the historical data object, and then assigns rows to the cells specified in the free report. For more detailed operation of this component, please refer to the instructions of Zijinqiao Software.
Advantages: It is convenient to collect historical values ​​with fixed or unfixed number of lines.
Statistical reportFor some reports, some historical values ​​need to be calculated, such as the maximum value, minimum value, average value, or the difference between the maximum value and the minimum value of historical values ​​(such as the output) over a period of time. Such reports can be read by the SPC control or historical summary control statistics, and then written to the free report, you can also use statistical functions to obtain statistical values. The operating methods of SPC controls and historical summary controls are similar to the historical data objects mentioned above. The specific content and related functions can be referred to the Zijin Bridge software manual. The SPC control can sample statistics from historical data of any time period. Whether or not the SPC statistics point selects “No statistics†does not affect the SPC analysis; and the history summary control selects the statistical value of this point, and carries out historical summary. Points must be selected "Statistics", and statistics are often in units of hours, so compared to the SPC control, summary control statistics are more accurate, but the time span needs to be greater than one hour.
Here is to explain that for some accumulated values, such as production, sometimes need to get the difference in a period of time, some users often use the historical value of the ending time minus the historical value of the starting time, this approach is There are hidden dangers, because the system may not be running at the beginning or the end of the moment. In this case, the historical value will be a bad value -9999. Therefore, the recommended practice is to select the maximum statistical value during this period minus the minimum statistical value during this period (the system will automatically filter out bad values), but the speed of obtaining statistical values ​​will be slightly slower than the historical value. If the time span is very large, you can narrow down the statistical value.
Other historical reportsSometimes it may be necessary to count some discrete historical values. For example, in the inspection industry, the interval between each measurement may not be fixed, and the number of measurements may be uncertain. At this time, it is difficult to achieve the historical detection records using the aforementioned methods. Here are two recommended practices:
1. Set a marker point, which uses the change rate to save the history record. After each measurement, the value of the marker point is changed once. Other measurement values ​​also keep the historical record. Use the “Get all historical data object†component when querying. Called in the "history data" in the gallery, as shown:

Through this component, you can query all historical records within the specified range of this marker, and at the same time, you can query historical values ​​of other measured values ​​at that moment. For example, there are two A1 and A2 tag numbers in the project, and A1 is the tag point. Now we want to query all historical data of A1 on the day. For example, the result is a historical data at 12:23:18.102 and historical data at 18:43:25.358. At this time, we hope to query historical data of A2 at 12:23:18.102 and 18:43:25.358 at the same time. Enter the report setting interface of "Get all historical data" object:

It can be seen that the first three columns of the report are the data of the time, milliseconds, and the bit number of the query. You can add a column at the end of the report, such as A2.PV. See the figure above. And enter the following script = GetHisData2(A2.PV, Val(1,$R), Val(2,$R)) below. The significance of this script is to take the historical data of A2.PV, where time is the time in the first column on the left and milliseconds is the time in the second column on the left. When the component queries the historical data of A1.PV, it will automatically increase the number of rows of the report to store the corresponding data. At the same time, the script entered above is also automatically copied so that the subsequent columns can display the historical data of A2.PV at the corresponding time.
Advantages: no need to rely on a relational database, you can query the discrete history of irregular changes;
Disadvantages: Due to the limitations of the process database itself, character history cannot be saved.
2. After each measurement is completed, the measurement data is saved in a relational database, and then the history records in the relational database are queried by the free report.
Advantages: It is convenient to save character or non-character discrete history records;
Disadvantages: The need for relational library support;
This article briefly describes three ways to read the Zijin Bridge software history database: curves, functions, reports, and details the different operating methods for reading historical data using reports in various situations. Of course, there are more Other methods can choose. It is hoped that the above introduction will help you to operate the Zijinqiao Software, and hopes to play a role in attracting you. You are welcome to propose better methods of operation and discuss and improve each other.
we are professional battery manufacturer in heated clothing industry over 10 years. we make all kinds of li ion battery packs for heated jacket, wlectric jacket, heated sweatshirt, heated motorcycle gear, heated boots, heated shirt, heated slippers, electric heated jacket, heated pants, battery heated jacket, heated glove liners, heated ski gloves, heated coat womens, heated vest womens, heated underwear, electric clothing, heated motorcycle jacket, heated gloves and socks, heated hunting jacket, electrician pants, heated hat, battery operated gloves.
we offer the most extensive models for heating clothing industry, our heating clothing batteries range from 3.7v to 14.8v most popular models, capacity from 1800mah to 10000mah, with LED light and switches to display remaining power level and set output levels. OEM/ODM accepted and we are specilisted in design these batteries, providing industry design, pcb design, tooling design, moulding service, prototyping, and flexiable small quantity manufacturing.

Heated Clothing Battery,Heated Jacket Battery,Heated Gloves Battery,Heated Vest Battery
Asarke Industry Co., Limited , https://www.asarke-industry.com