The quantitative representation of the difference in color perception is represented by the difference in the three color attributes of lightness, hue, and chroma. The difference in brightness indicates the difference in depth, the difference in hue indicates the difference in hue (ie, reddish or bluish, etc.), and the difference in chroma indicates the difference in vividness. Color difference evaluation is very important in industry and commerce, mainly used in color matching in production and color quality control of products.
In 1931, the CIE (International Standard Lighting Commission) established a series of color space standards that represent the visible spectrum. Since any color can be a mixture of RGB three primary colors, the CIE-RGB primary color system is defined. However, this system has an obvious disadvantage. When calculating the color tristimulus value, a negative value occurs, which causes inconvenience to a large amount of calculation. Since any one of the primary color systems can be switched from one system to another, one can choose any desired primary color system to avoid negative values ​​and is easy to use. Based on this CIE, the CIE-XYZ system is also recommended. This system uses the three primary colors of the imaginary X, Y and Z, which do not correspond to the visible colors.
CIE-XYZ's three primary color stimuli values ​​X, Y, and Z are useful for defining colors. The disadvantage is that they are more complicated to use and not intuitive. For a given color, if you increase its brightness, the luminous flux of each primary color also needs to be proportionally increased, and the chromaticity value is only related to the wavelength (hue) and purity, independent of the total radiant energy, so the color is calculated. In the chromaticity, the X, Y and Z values ​​are normalized with respect to the total radiant energy = (X + Y + Z), and the color matching equation can be normalized to x + y + z = 1. According to the color coordinates (x, y), z can be determined, but it is not possible to derive only three primary color stimulus values ​​X, Y and Z from x and y, and also to use the Y value carrying the luminance information, the value and the Y stimulation value in XYZ. Consistent. This in turn defines the CIE-xyY color space.

Figure 1 LAB color space coordinates
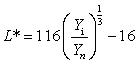
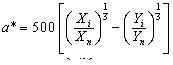
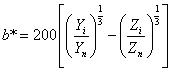
The distance between the XYZ system and the two colors represented on its chromaticity diagram is inconsistent with the change perceived by the color observer. This problem is called perceptual uniformity. In order to solve the problem of perceived consistency of color space, the experts made a nonlinear transformation of CIE-XYZ system and developed CIE-L*a*b* color space. The color space coordinates are as shown in Fig. 1. The CIE-L*a*b* color space indicates the brightness of the color with an L value, the a value indicates the green red value of the color, and the b value indicates the blue-yellow value of the color. The L, a, and b values ​​can be calculated by XYZ, and the calculation formula is as follows:
 2.1
2.1
 2.2
2.2
 2.3
2.3
Where X i Y i Z i is the tristimulus value of the reference sample or the sample to be tested, and X n Y n Z n is the tristimulus value of the standard illuminant.

Figure 2 LCH color space coordinates
The CIE-LCH color space is derived from the CIE-L*a*b* color space, which uses L for the brightness value; C for the saturation value and H for the hockey coordinate value. The color space coordinates are shown in Figure 2. The three attributes that people describe in daily life are brightness L, hue H, and saturation C. Therefore, using CIE-LCH color space to describe color is more in line with people's habits of color description in daily life.
 2.4
2.4 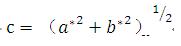 2.5
2.5
If we simply judge a certain color by a set of L*a*b* or Lch values, it doesn't have much practical meaning, but when we compare two colors, we can use the difference between the two colors. Determine the difference between them. By comparing the product and standard color sample values, we can easily know the color status of the current product. Through the two sets of L*a*b* values, we can calculate the color difference between the two colors, and the color difference is calibrated by ΔE ab * , △L * , Δa * , △b * . The CIELAB color difference formula is as follows:
 2.6
2.6 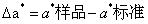 2.7
2.7  2.8
2.8  2.9
2.9
â–³E *The total color difference, â–³L * large means white, â–³L * small means black, â–³a * large means reddish, â–³a * small means greenish, â–³b * large means yellowish,â–³b * Small means bluish.
In the L*, a*, b* Cartesian coordinate system, the cylindrical polar coordinate system of L*, c*, h* can be derived. The formula is as follows:
 2.10
2.10  2.11
2.11  2.12
2.12 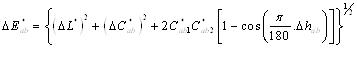
South Korea imported TPU material to ensure the clarity of the High-Definition Protective Film and rainbow-free visual effects.
The Flexible Soft Film is tightly attached to the entire screen, and the surface will not warp, providing maximum protection for your screen.
The High-Definition Screen Protector can keep the touch accuracy of the device unchanged. With anti-fingerprint, oleophobic coating and bubble-free installation features, you can enjoy all the features of the device without worrying about scratches or other marks on the new device.
Ultra-Clear Screen Protector uses nano-fusion technology to automatically repair micro-scratches, easily resist daily scratches, leaving no traces and automatically repairing.
If you want to know more about HD Screen Protector products, please click the product details to view the parameters, models, pictures, prices and other information about HD Protective Film.
Whether you are a group or an individual, we will try our best to provide you with accurate and comprehensive information about the HD Hydrogel Screen Protector!
HD Screen Protector, High-Definition Screen Protector, HD Hydrogel Film, HD Clear Screen Protector, Hydrogel Film,Transparent Screen Protector
Shenzhen Jianjiantong Technology Co., Ltd. , https://www.jjttpucuttingplotter.com