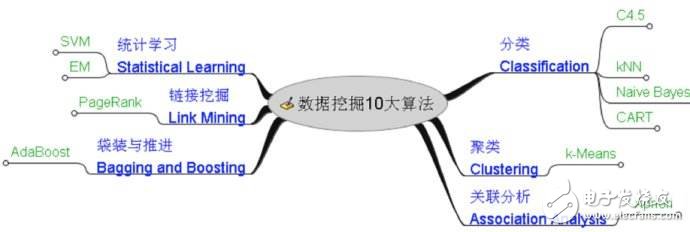
Data mining (English: Data mining), also translated into data exploration, data mining. It is a step in Knowledge-Discovery in Databases (KDD). Data mining generally refers to the process of searching for information hidden in it from a large amount of data through an algorithm. Data mining is often associated with computer science and achieves these goals through statistics, online analytical processing, intelligence retrieval, machine learning, expert systems (reliant on past rules of thumb), and pattern recognition.

Analysis
The C4.5 algorithm is a classification decision tree algorithm in machine learning algorithms, and its core algorithm is ID3 algorithm. The C4.5 algorithm inherits the strengths of the ID3 algorithm. And in the following aspects of the ID3 algorithm has been improved:
1) Using the information gain rate to select attributes, overcomes the shortcomings of using the information gain to select attributes when biasing the selection of more attributes.
2) pruning during tree construction;
3) The discretization of continuous attributes can be completed;
4) Incomplete data can be processed.
The C4.5 algorithm has, for example, the following advantages: the resulting classification rules are easy to understand and the accuracy is high. The disadvantage is that in the process of constructing the tree, the data set needs to be scanned and sorted multiple times, which leads to the inefficiency of the algorithm.
1. Machine learning. The decision tree is a predictive model. He represents a mapping between object properties and object values. Each node in the tree represents an object, and each forked path represents a possible attribute value, and each leaf node
The value of the object represented by the path from the root node to the leaf node. The decision tree has only a single output. If you want to have a complex output, you can create an independent decision tree to handle different outputs.
2. Machine learning techniques that generate decision trees from data are called decision tree learning. Popularly speaking, decision trees.
3. Decision tree learning is also an ordinary method in data mining. Here, each decision tree represents a tree structure, and his branches rely on attributes to classify objects of that type. Each decision tree can rely on cutting the source database
Conduct data testing.
This process recursively trims the tree.
When it is no longer possible to cut or a separate class can be applied to a branch. The recursion process is complete.
Also. Random forest classifier combines many decision trees
To improve the accuracy of the classification.
2. K-means algorithm: is a clustering algorithm.The term "k-means" was first proposed by James MacQueen in 1967. This view dates back to the ideas put forward by Hugo Steinhaus in 1957. 1957. Stuart Lloyd first proposed this standard algorithm, which was originally applied as a technique for pulse code modulation. Until 1982, this algorithm was officially proposed at Bell Labs. 1965. EWForgy published a method that is essentially the same. 1975 and 1979. HarTIgan and Wong each proposed a more efficient version number.
Algorithm description
Input: number k of clusters; data set D including n objects.
Output: A collection of k clusters.
method:
Select k objects from D as the initial cluster center;
Repeat;
Based on the mean of the objects in the cluster. Assign each object to the most similar cluster;
Update the cluster mean. That is, calculate the mean of the objects in each cluster;
Calculation criterion function;
The unTIl criterion function no longer changes.
Widely used in statistical classification and regression analysis in support vector machines, English is Support Vector Machine, referred to as SV machine (referred to as SVM in the paper). It is one
A supervised learning method that is widely used in statistical classification and regression analysis.
Support vector machines are generalized linear classifiers. They can also be considered as a special case of the TIkhonov RegularizaTIon method. The characteristic of this family of classifiers is that they can minimize empirical error and maximize at the same time.
Geometric edge zone. Therefore, the support vector machine is also called the maximum edge region classifier. In statistical calculations, the Maximum Expectation (EM) algorithm is an algorithm that looks for a parameter maximum likelihood prediction in a probabilistic model. The probability model depends on none
The hidden variable of the law observation (Latent Variabl).
Maximum expectations are often used in the field of data clustering for machine learning and computer vision.
The maximum expectation algorithm is calculated alternately in two steps:
The first step is to calculate the expectation (E), that is, to include the hidden variable as it can be observed to calculate the expected value of the maximum likelihood;
Another step is to maximize (M), which is to maximize the expected value of the maximum likelihood found on the E step to calculate the maximum likelihood prediction of the parameter.
The parameters found on the M step are then used for another E step calculation, which is alternated.
Vapnik et al. proposed a design best criterion for linear classifiers based on years of research on statistical learning theory. The principle is also linear from the point of view, and then extended to the case of linear indivisibility.
Even extended to use non-linear functions, this
A classifier is called a Support Vector Machine (SVM). The support vector machine has a very deep theoretical background. The support vector machine method is a new method proposed in recent years.
The main idea of ​​SVM can be summarized as two points:
(1) It is for the linear separability case. For the linear indivisible case, the nonlinear indivisible sample of the low-dimensional input space is transformed into the high-dimensional feature space by using the nonlinear mapping algorithm.
The linearity is separable, which makes it possible to linearly analyze the nonlinear characteristics of the sample using a linear algorithm in the high-dimensional feature space;
(2) It constructs the optimal cutting hyperplane in the feature space based on the structural risk minimization theory, so that the learner is globally optimized, and the expected risk in the entire sample space satisfies a certain upper bound with a certain probability.
When learning such a method, we must first understand the characteristics of such a method to consider the problem. This should be discussed from the simplest case of linear separability. Before you understand the principle, do not rush to learn linear indivisible and more complicated. Situation, support vector machine
At the time of design. The solution to the conditional extreme value problem is required. Therefore, the Lagrangian multiplier theory is required. But for most people. What has been learned or used frequently is the way in which the constraint is represented by an equation. However, it is necessary to use the inequality as a condition that must be met. At this time, it is only necessary to understand the relevant conclusions of the Lagrangian theory.
4. Apriori: is one of the most influential algorithms for mining frequent itemsets of Boolean association rules.The Apriori algorithm is the most influential algorithm for mining frequent itemsets of Boolean association rules. Its core is a recursive algorithm based on the idea of ​​two-stage frequency set. The association rule belongs to a single-dimensional, single-layer, and Boolean association rule in classification.
Here, the set of items whose total support is greater than the minimum support is called a frequent item set (referred to as a frequency set), and is often referred to as a maximum item set.
In the Apriori algorithm, the basic idea of ​​finding the largest set of items (frequent itemsets) is that the algorithm requires multiple steps to process the data set. The first step is to simply count the frequency of all occurrences of an elemental item set and find those items that are not less than the minimum support, ie the one-dimensional largest set of items. Loop processing from the second step until no more maximum project set generation. The loop process is: in step k, the k-dimensional candidate item set is generated according to the (k-1)-dimensional maximum item set generated in step k-1. Then search the database to get the item set support of the candidate item set. Compare with the minimum support to find the largest set of k-dimensional items.
From the execution of the algorithm. We can see the strengths of the Apriori algorithm: simple, easy to understand, and low data requirements. However, we can also see the shortcomings of the Apriori algorithm:
(1) There are too many combinations of loops generated at each step to generate a candidate item set, and no elements that should not participate in the combination are excluded;
(2) Each time the calculation of the item set is supported, all the records in the database D are scanned and compared. Assuming a large database, such a scan comparison will greatly increase the I/O overhead of the computer system. The price is such that the addition of a geometric progression is added as the database's records are added.
So people are looking for algorithms that perform better. Such as the FP algorithm.
5. EM: Maximum expected value method.The Maximum Expectation Algorithm (Expectation-maximization algorithm) is used in the statistic to find the maximum likelihood prediction of the parameter in the probability model of the unobservable implicit variable.
In statistical calculations, the Maximum Expectation (EM) algorithm is an algorithm that looks for a parameter maximum likelihood prediction or a maximum a posteriori prediction in a probability model. The medium probability model relies on the Latent Variable that cannot be observed. The greatest expectation is often used in the field of data clustering for machine learning and computer vision.
The maximum expectation algorithm is calculated alternately in two steps. The first step is to calculate the expectation (E), and to calculate the maximum likelihood prediction value from the existing predicted values ​​of the hidden variables; the second step is to maximize (M). Maximize the maximum likelihood value found on the E step to calculate the value of the parameter. The predicted values ​​of the parameters found on the M step are used in the next E step calculation, which is alternated.
M is an iterative technique for predicting unknown variables in the case of known partial related variables. The algorithm flow of EM is as follows:
1. Initialize the distribution parameters
2. Repeat until convergence:
Step E: Estimate the expected value of the unknown parameter and give the current parameter estimate.
Step M: The distribution parameters are again predicted to maximize the likelihood of the data, giving the expected prediction of the unknown variable.
Applied to missing values
Maximum expected process description
We use the values ​​of the incomplete variables that can be observed to represent the values ​​of the variables that cannot be observed, and together they form the complete data.
It may be the actual measurement of the missing data, or it may be a hidden variable that simplifies the problem, assuming its value is known. For example, in the Mixture Model, it is assumed that the maximum likelihood formula of the "generating" sample is more convenient (see the example below).

PageRank. Page rank, also known as page level, Google left ranking or Page ranking, is a technique that is calculated by search engines based on hyperlinks between web pages, and as one of the elements of web ranking, by Google founder Named after the name of Larry Page. Google uses it to reflect the relevance and importance of web pages, and is often used in search engine optimization to evaluate the effectiveness of web page optimization. Google founders Larry Page and Sergey Brin invented the technology at Stanford University in 1998.
PageRank determines the level of a page through the vast network of hyperlinks.
Google interprets the link from page A to page B as the page A to vote for page B. Google determines the new rating based on the source of the vote (even the source of the source, ie the page linked to page A) and the rating of the voting target.
Simply put, a high-level page can raise the level of other low-level pages.
7. Adaboost: It is an iterative algorithm whose core idea is to train different classifiers for the same training set and then combine the weak classifiers to form a stronger final classifier.AdaBoost. It is an abbreviation for "Adaptive Boosting" in English and is a machine learning method. Presented by Yoav Freund and Robert Schapire.
The adaptation of the AdaBoost method is that the sample of the previous classifier error is used to train the next classifier. The AdaBoost method is very sensitive to noise data and abnormal data. But in some problems. The AdaBoost method is relative to most other learning algorithms. It is not very easy to have a fitting phenomenon.
The classifier used in the AdaBoost method may be very weak (for example, a very large error rate), but only if its classification effect is better than random (for example, the classification error rate of the two types of problems is slightly less than 0.5), the improved model is improved. A weak classifier with an error rate higher than that of a random classifier is also practical. Since a linear combination of a plurality of classifiers finally obtained can be given a negative coefficient, the same can also improve the classification effect.
The AdaBoost method is an iterative algorithm. Add a new weak classifier to each round until a predetermined small enough error rate is reached. Each training sample is given a weight. Indicates the probability that it will be selected into the training set by a classifier.
Assuming that a sample point has been accurately classified, the probability that it will be selected is reduced in constructing the next training set;
in contrast. Assuming that a sample point is not accurately classified, its weight is increased. In this way, the AdaBoost method can "focus" on those samples that are more difficult to distinguish (more informative).
In the detailed implementation, the weight of each sample is initially equal, for the kth iteration. We use these weights to select sample points and then train the classifier Ck. Then, based on this classifier, the weight of the sample that is faulted by it is increased, and the sample weights that are correctly classified are reduced.
The weighted updated sample set is then used to train the next classifier Ck[2]. The entire training process proceeds so iteratively.
8. KNN: It is a theoretically mature method and one of the simplest machine learning methods.1. K-Nearest Neighbor (KNN) classification algorithm. It is a theoretically mature method. It is also one of the simplest machine learning algorithms. The idea of ​​this method is to assume that a sample is the most similar in the feature space (ie, the feature is empty).
Most of the samples that are closest to each other belong to a certain category, and the sample also belongs to this category.
2. In the KNN algorithm, the selected neighbors are all objects that have been correctly classified.
The method determines the category to which the sample to be classified belongs based on only the category of the nearest one or several samples in the class decision.
The KNN method, in principle, also relies on the limit theorem. However, in class decision making, it is only related to a very small number of adjacent samples. Because the KNN method relies mainly on surrounding limited samples.
Rather than relying on the method of discriminating the class domain to determine the category, the KNN method is more suitable than other methods for the sample group to be divided or overlapped.
3. The KNN algorithm can be used not only for classification but also for regression. By identifying the k nearest neighbors of a sample and assigning the average of the properties of these neighbors to the sample, the properties of the sample can be obtained.
A more practical approach is to take different distances
The influence of the neighbor on the sample is given a different weight, such as the weight is proportional to the distance.
4. The basic shortcoming of the algorithm in classification is that when the sample is unbalanced, such as the sample size of one class is very large, and the sample size of other classes is very small, it may cause the sample to be input when a new sample is entered. The sample of large-capacity classes among the K neighbors is the majority. Therefore, it is possible to improve by using a weighting method (which has a large neighbor weight with a small sample distance).
The disadvantage of this method is that the amount of calculation is large, since the distance to all known samples is calculated for each text to be classified. Can only find its K nearest neighbors.
The solution that is often used at the moment is to edit the known sample points in advance and remove the samples that have little effect on the classification. The algorithm is more suitable for self-active classification of the class domain with larger sample size, and those domain with smaller sample size are easier to use with such an algorithm.
The algorithm classification steps are as follows:
1 First we set the k value in advance (that is, the size of k of the k-nearest neighbor method. For a data point to be classified, we are looking for a few of its neighbors). Here to illustrate the problem, we take two k values. 3 and 9 respectively;
2 Based on a predetermined distance measurement formula (eg Euclidean distance). The sample points to be classified and the sample points of all known categories are obtained. Distance to recent k samples.
3 Count the k sample points. The number of each category. According to the category of the most sampled samples of k samples, we will determine the category of this data.
9. Naive Bayes: Among the many classification methods, the most widely used decision tree model and Naive BayesThe basis of Bayesian classification is probabilistic reasoning. It is uncertain in the existence of various conditions. How to complete the reasoning and decision-making tasks only when the probability of occurrence is known. Probabilistic reasoning corresponds to deterministic reasoning.
The naive Bayes classifier is based on independence, ie if each feature of the sample is not related to other features. For example, if a fruit has red color. Round, about 4 inches in diameter and so on. The fruit can be judged to be an apple.
Although these features are interdependent or some are determined by other features. However, the Naive Bayes classifier feels that these attributes are independent in determining the probability distribution of whether the fruit is apple. The Naive Bayes classifier relies on an accurate natural probability model to obtain good classification results in a sample set with supervised learning. In many practical applications. The naive Bayesian model parameters are expected to use the maximum likelihood prediction method. In other words, the naive Bayesian model works without a Bayesian probability or whatever Bayesian model.
Although it is with these simple ideas and oversimplification, the Naive Bayes classifier can still achieve quite good results in many complicated realities. year 2004. An article analyzing Bayesian classifier problems reveals several theoretical reasons why the Naive Bayes classifier achieves seemingly incredible classification effects.
Nonetheless, in 2006, an article specifically compared various classification methods and found that updated methods (such as boosted trees and random forests) outperformed Bayesian classifiers.
One advantage of the naive Bayes classifier is that it only needs to estimate the necessary parameters (mean and variance of the variables) based on a small amount of training data. Because variables are independent, you only need to predict the method of each variable. It is not necessary to determine the entire covariance matrix.

The core of decision tree growth is to determine the branching criteria of the decision tree.
1. How to choose a current optimal branch variable from among a number of attribute variables.
That is to choose the variable that can reduce the heterogeneity the fastest.
Measures of heterogeneity: GINI, TWOING, least squared deviation.
The first two are mainly for subtype variables, and the LSD is for continuous variables.
Agent partitioning, weighted partitioning, prior probability
2. How to find a current optimal cutting point (cutting threshold) from the numerous values ​​of the branch variable.
(1) Cutting threshold:
A. Numeric variables - Sort the values ​​of the records from small to large, and calculate the heterogeneity statistics of the child nodes generated by each value as a critical point.
The critical value that maximizes the degree of heterogeneity reduction is the optimal partition point.
B. Subtyped Variables - Lists all possible combinations divided into two subsets. Calculate the heterogeneity of the generated child nodes under each combination. the same. Find the combination that minimizes the degree of heterogeneity as the best dividing point.
At each node of the decision tree we are able to divide by any value of any of the attributes. Which division is best? There are three criteria that can be used to measure the quality of the division: the GINI index, the doubled index, and the ordered doubled index.
Stylus Pen For Microsoft Surface
Product catagories of Stylus Pen For Microsoft Surface, which just can be worked on below Surface model, Please confirm your surface model before buying.
Microsoft Surface 3; Microsoft Surface Pro 3; Microsoft Surface Pro 4; Microsoft Surface Pro 5; Microsoft Surface Pro 6; Microsoft Surface Book; Microsoft Surface Laptop; Microsoft Surface Studio.
Stylus Pen For Microsoft Surface,Tablet Touch Pen,Touch Screen Stylus Pen,Universal Stylus Pen
Shenzhen Ruidian Technology CO., Ltd , https://www.wisonens.com